DS1615
Standalone temperature data logger with DS1615
The DS1615 chip from Dallas Semiconductor is a temperature recorder. The temperature sensor is integrated in the chip and measures temperatures from -40°C to +85°C in 0.5 degree steps. The time between measurements can be set from 1 to 255 minutes. A maximum of 2048 measured values are stored.
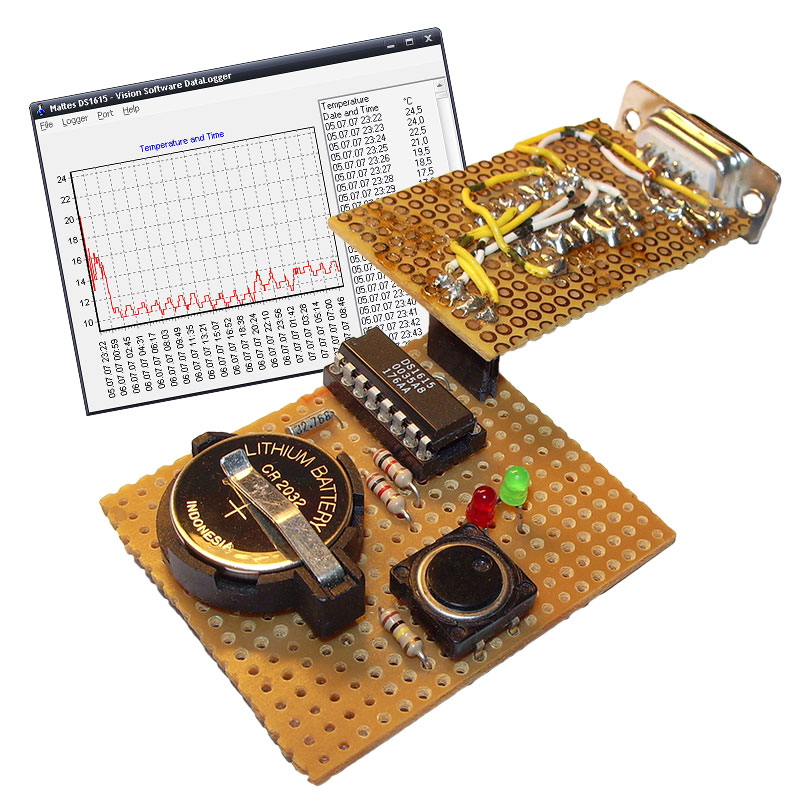
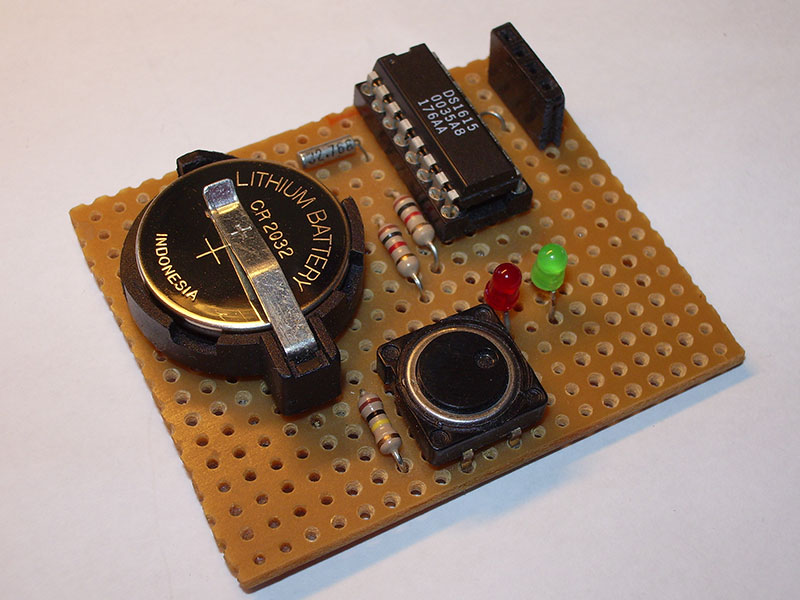
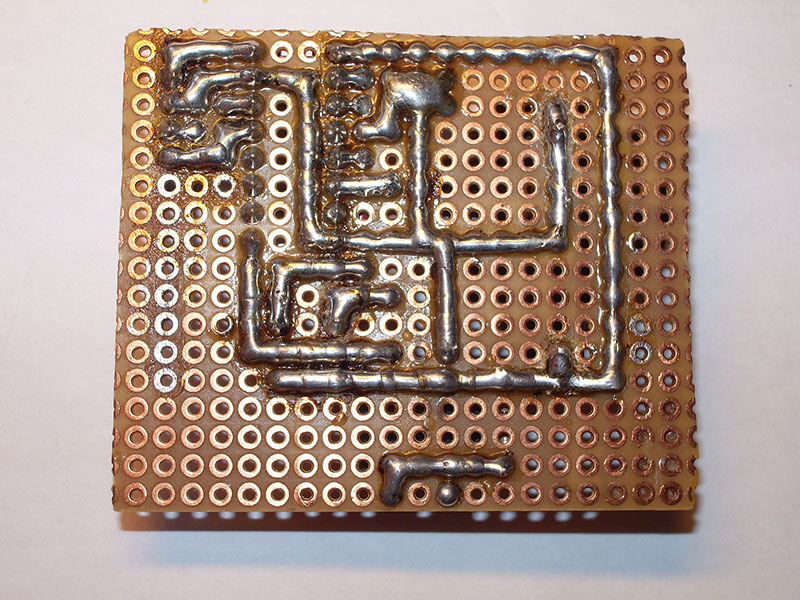
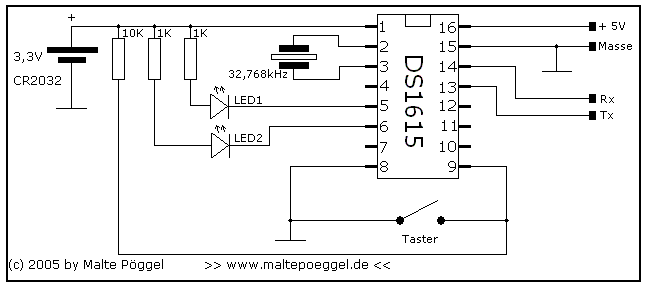
The DS1615 needs almost no external circuitry. The prototype was made on a breadboard.
Circuit diagram
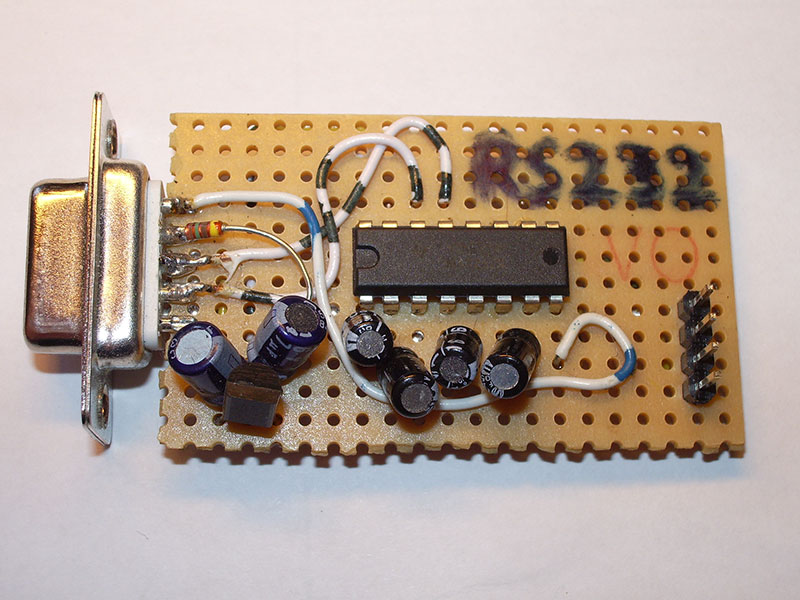
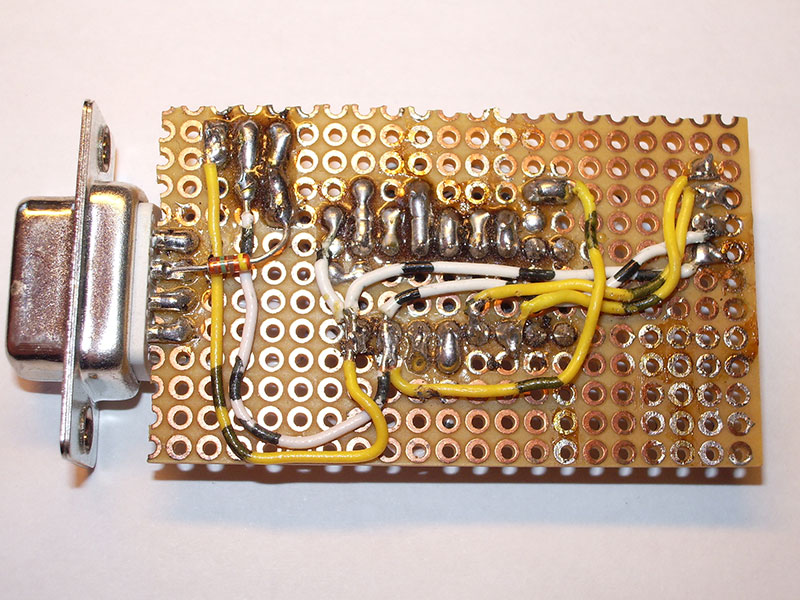
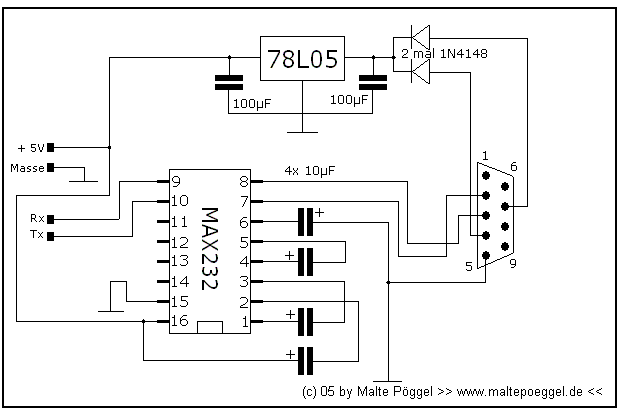
A PC interface is needed for this:
The two LEDs inform the user about the current status of the measurement.
First the chip has to be programmed. To do this, click for example in the software "Vision Software Datalogger" in the menu on Logger -> Setup.
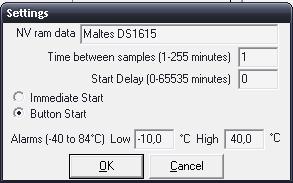
The option here is set to Button Start, so that the logger later can be started manually by pressing the button. After pressing it, the measurement is started with 0 minutes delay and a value is recorded every minute. The temperature range may be between -10 and 40 degrees, otherwise an alarm is stored.
After configuration the measurement can start. The button is pressed to start logging. The DS1615 acknowledges this by both LEDs flashing simultaneously four times in succession. When logging is running, pressing the button causes one of the two LEDs to flash (depending on whether the temperature is within the range defined on the PC or not). If no temperature value has been recorded between start and pressing the button, the diodes flash alternately. (e.g. Start Delay on 5 minutes and before expiration the button was already pressed)
After enough data has been collected, the temperature logger is reconnected to the PC. I had just put my logger in the fridge starting from room temperature.
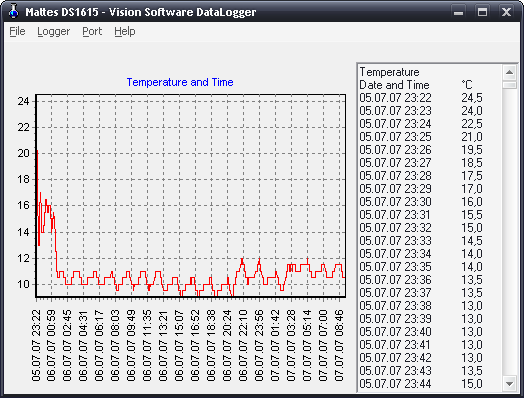
A click on Logger -> Read All reads the data. First a histogram is displayed. After a click on Logger -> Temperature the curve temperature / time is shown. In my example you can see exactly when the thermostat in the refrigerator has responded and switched the compressor on or off.
